
In affiliate marketing, money is lost not only because of weak creatives, underperforming offers or expensive traffic. The problem often goes deeper: it lies in how a team sees its data and how quickly it can identify the exact point where the funnel stops working.
Performance marketing has moved far beyond the simple approach of running traffic, checking ROI and making a decision. Today, media buying teams operate in an environment where data comes from multiple sources, events pass through several technical layers, costs may be updated with a delay, and traffic quality can vary significantly across segments. The final financial result depends not only on the click or lead, but on the entire user journey through the funnel.
This is why BI analytics is becoming part of the core infrastructure for affiliate teams rather than an additional reporting tool. Its purpose is not to present numbers in attractive charts, but to connect fragmented data into one manageable system.
The Main Value of BI Is Faster Decision-Making
In media buying, delays in analytics almost always result in direct losses. The later a team realizes that part of the funnel is not working correctly, the more budget continues to be spent on traffic that is no longer producing the required result.
A dashboard makes it possible to monitor changes across the entire funnel in one place. This helps teams identify weak tests faster, detect performance drops before they become expensive and make decisions based on the complete system rather than assumptions.
This is the difference between BI and regular tracker statistics. Tracker statistics record what happened. BI helps explain how it affected the financial result.
BI Helps Separate Volume from Quality
One of the most dangerous mistakes in media buying is evaluating traffic only by the number of events. An increase in clicks, leads or registrations may look positive, but without quality analysis it guarantees nothing. When analytics does not separate valid traffic from low-quality traffic, the final data no longer reflects the actual result.
At lower volumes, these distortions can still be partially compensated for through manual control. This approach quickly becomes ineffective during scaling. The more sources, offers, landing pages, domains and buyers involved in the process, the harder it becomes to understand what is actually driving growth. BI analytics prevents scaling from turning into a blind increase in ad spend. It shows how traffic quality changes as volume grows: whether conversion remains stable across the funnel, whether the final financial result begins to decline and whether certain combinations start generating more activity than profit. With this approach, the team does not scale whatever produces more clicks or leads. It scales what can handle higher volume while continuing to deliver results.
BI therefore becomes a system for controlling scale. Without it, a team may continue increasing budgets while remaining in the same position: more data, more events, more expenses and still no clear understanding of where profit is actually being generated.
BI Analytics in AIO Is a Practical Media Buying Tool
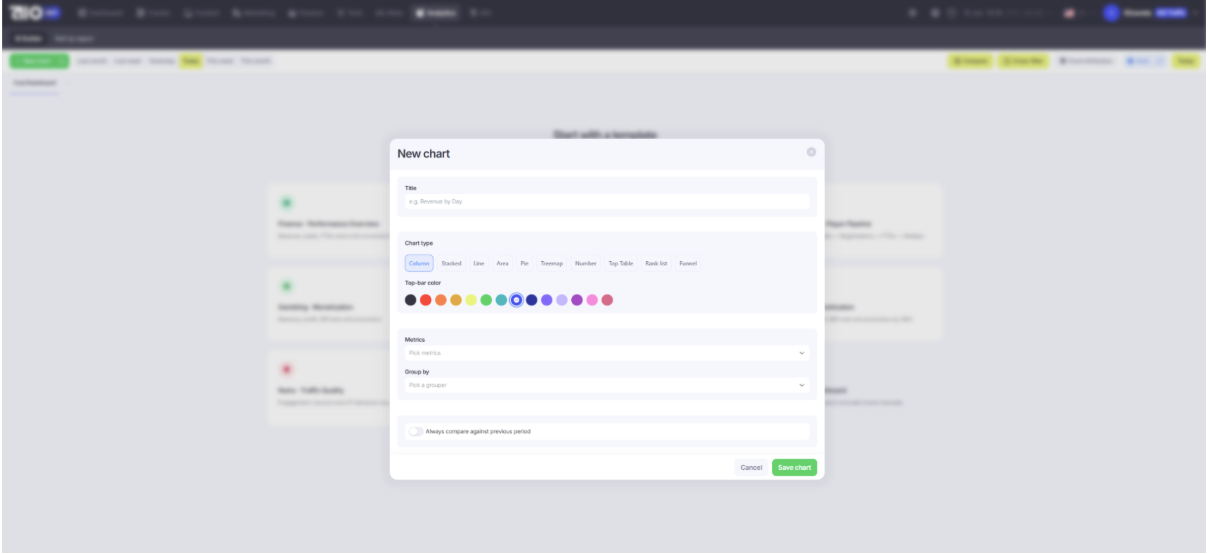
AIO has introduced BI Builder for creating custom dashboards directly within the platform. It allows teams to analyze media buying according to the structure of their actual funnel rather than relying on a fixed report with a predefined set of data.
BI Builder makes it possible to create a dashboard for a specific task or vertical. A team can start with a ready-made template or build a dashboard from scratch when it has a non-standard funnel, its own KPIs or a specific approach to evaluating traffic.

An important advantage of BI Builder is the ability to connect traffic, costs, revenue, profit and performance in one screen. Instead of fragmented numbers from different services, the team gets a complete view of each launch: how much traffic arrived, how it moved through the funnel, where its quality changed, what financial result it produced and which segments require attention.
Teams can also add their own metrics and build analytics for different roles. Buyers can see which campaigns should be stopped, reviewed or scaled. Team leads get an overall view of performance and can detect changes in traffic quality and launch results faster. Owners can monitor expenses, revenue, profit and the contribution of different directions to the overall result.
BI Builder also includes period comparison, interactive filters, and event attribution. These functions help teams quickly understand whether results have improved or declined, examine a specific source, campaign, or GEO, and determine which events are actually connected to the relevant traffic and outcome.
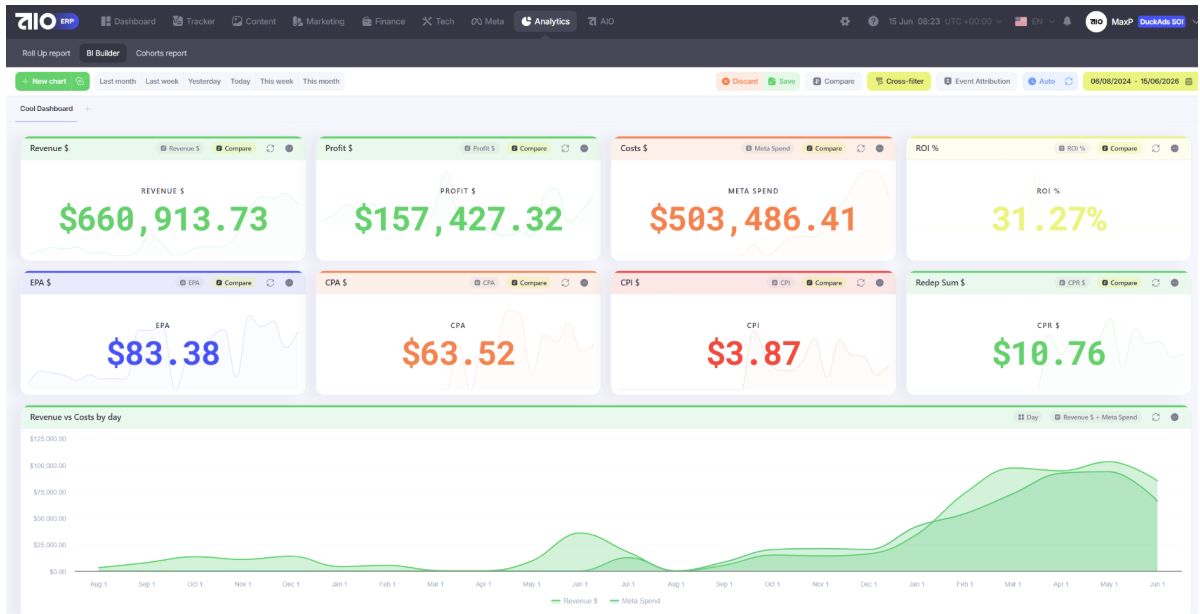
BI Dashboards in AIO
Another major advantage is the ability to build custom charts, diagrams, tables, and metric cards around the team’s own data. The team decides which metrics should appear on the screen and how they should be displayed: as changes over time, a comparison between costs and revenue, or a breakdown by sources, campaigns, GEOs, buyers, and funnel stages.
This means teams do not have to adapt their decisions to the structure of a ready-made report. Instead, they can build a visualization around a specific question: where profit declined, which source reduced traffic quality, how ROI changed after scaling, or which landing page stopped moving users to the next stage.
Book a demo to see how BI analytics can help your team launch traffic more efficiently and improve profitability. Submit a request on the AIO website or contact the AIO team on Telegram @aio_presale.

Hi, I’m Taisia Kusakina – web designer and content manager.


Sending the message, you agree to follow by the terms of our. Privacy policy.